< Projects
Attaching Splunk Observability (O11y) to Splunk Cloud
MY ROLE | Lead User Researcher
Designed study plan, research questions, interview script
Facilitated interviews
Led analysis & synthesis, designed and facilitated synthesis workshops
Created presentations, documents, frameworks to communicate findings & recommendations
Presented (and co-presented) findings & recommendations with design leadership
Designed and facilitated cross-functional solutions workshops
DURATION | ~3 months (including research reporting and workshops)
IMPACT |
Findings & recommendations pasted in 3-year product strategy + accompanying roadmaps for 5+ workstreams.
Prioritized unification of backend services and admin experience workstreams.
Defined front-end re-design prioritites.
4 new project workstreams created based on research findings.
DIRECT STAKEHOLDERS | Sr. Director of Product Design, Sr. Director of Product Management, User Research Manager, Observability Design / Eng / PM teams.
METHODOLOGIES | User interviews, Jobs-to-be-Done prioritization activity, findings workshops
background & problem space
A shift in our go-to-market strategy led us to target current Splunk Cloud customers with our Observability offering. These two products have significant overlap in use cases.
What would it look like if we were to integrate our new Observability offering with our customers’ existing Splunk Cloud instances?
research questions
To what degree should we integrate the two products? Does it make sense to maintain two distinct products, or should they be combined into one “super tool”?
What is the overlap between users & use cases of Splunk Cloud and Splunk Observability? How does this overlap impact our users’ experience with either/both product(s)?
Which experience should we integrate first: the admin experience, or the end user experience?
Which jobs-to-be-done are most important for the integration of Observability and Splunk Cloud?
methods
SEMI-STRUCTURED INTERVIEWS (16 participants + 3 pilots)
To identify the current tooling strategy, long-term vision, usage, and pain points of both admins and end users who use a combination of Splunk Observability and Splunk Cloud.
Jobs-to-be done analysis
PM needed input on which jobs-to-be-done were most important to users’ efforts to integrate their existing Splunk Cloud instance with their newly purchased Observability suite.
findings Workshops - how might we?
We translated high-level strategic recommendations into actionable takeaways for the individual product workstreams.
key findings, insights, and recommendations
These are just a few of many findings. The full report is packed full with more insights, quotes, highlight clips, and recommendations. Please contact me if you’d like to learn more.
INSIGHT 1:
End Users have a center of gravity in one tool – they need to start from the place they are most comfortable.
There are 2 primary end-users to design for:
The Heavy Splunk End-User
● Center of gravity in Splunk. Comfortable with Splunk Processing Languange (SPL).The Heavy O11y End-User
● Center of gravity in Observability. Not comfortable with SPL.
Why does this matter?
If we try and tell people to change their go-to tool by forcing them away from their center of gravity, we risk creating a comparison experience vs a complementary experience.
We need to respect each user’s center of gravity, and empower them to start their troubleshooting journey in whichever tool they prefer.
Outcome: product teams on both Splunk Core and Observability prioritized cross-product workflows: connecting and correlating data between tools to enable end-to-end troubleshooting workflows that reference data and features in both tools. Users can start in whichever tool they feel comfortable, and seamlessly jump to the next tool as-needed.
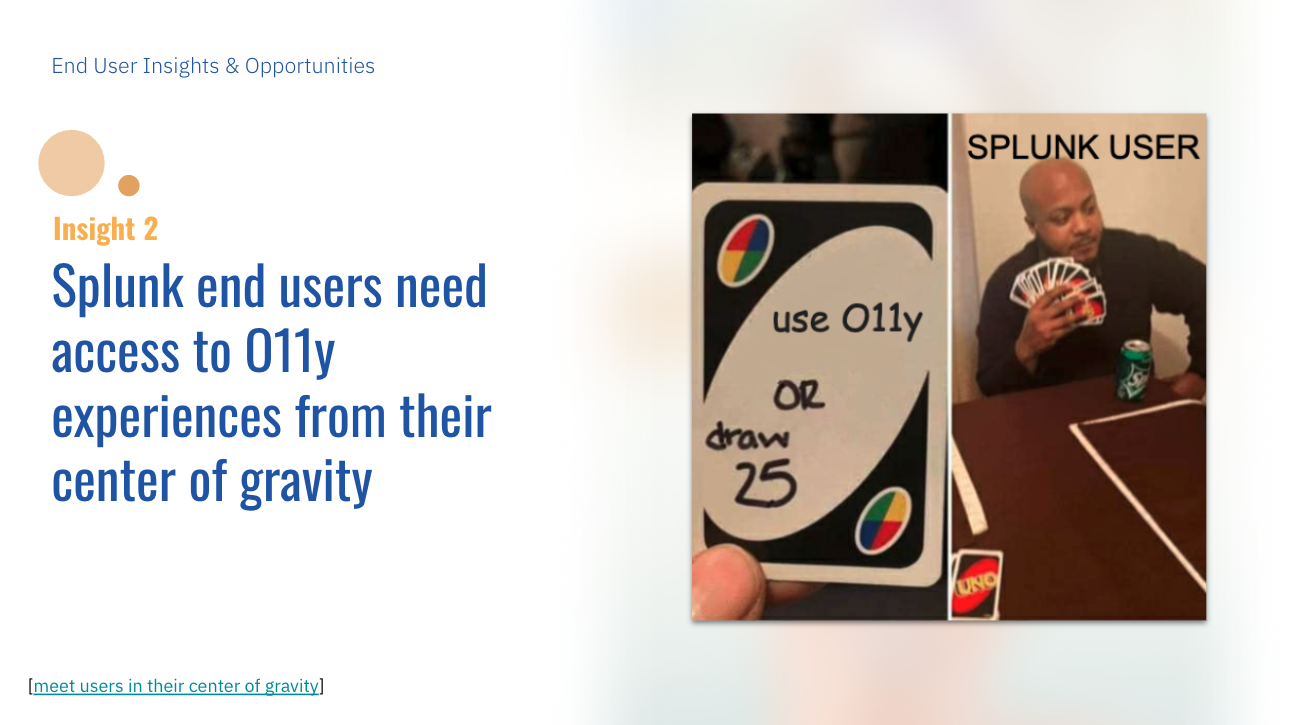
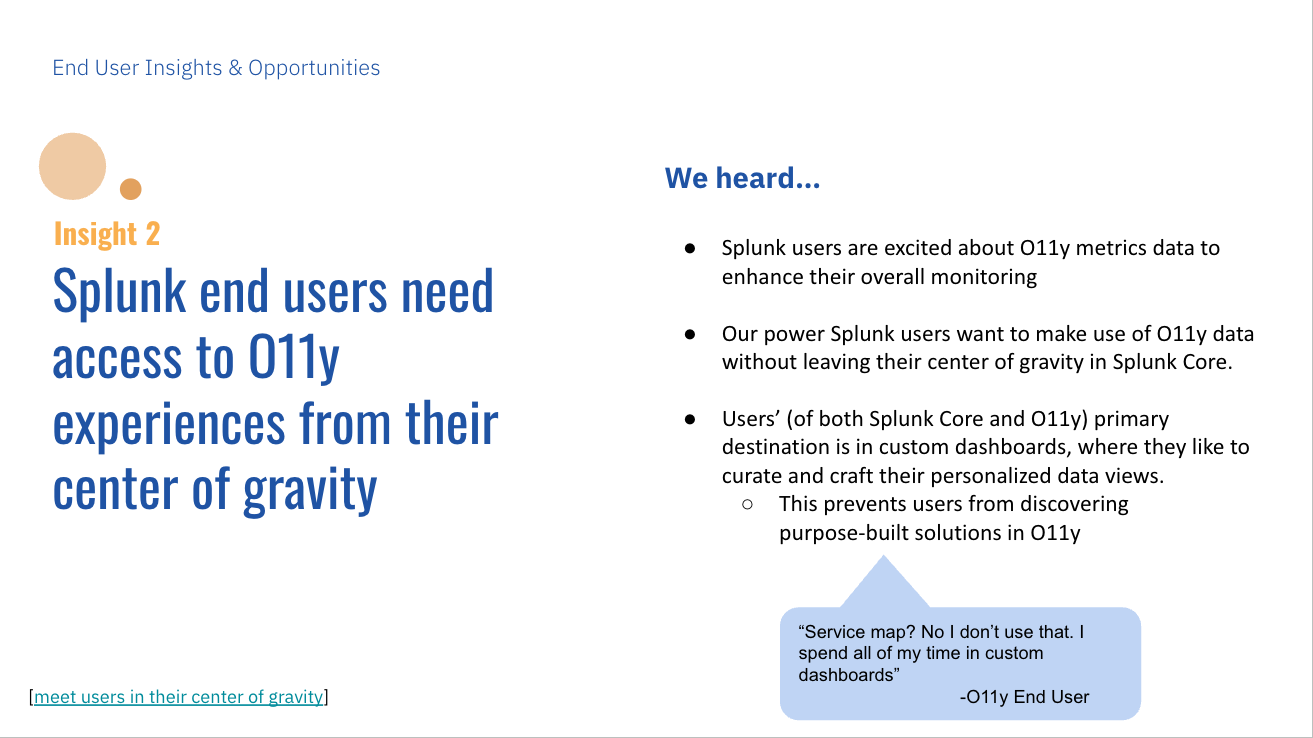
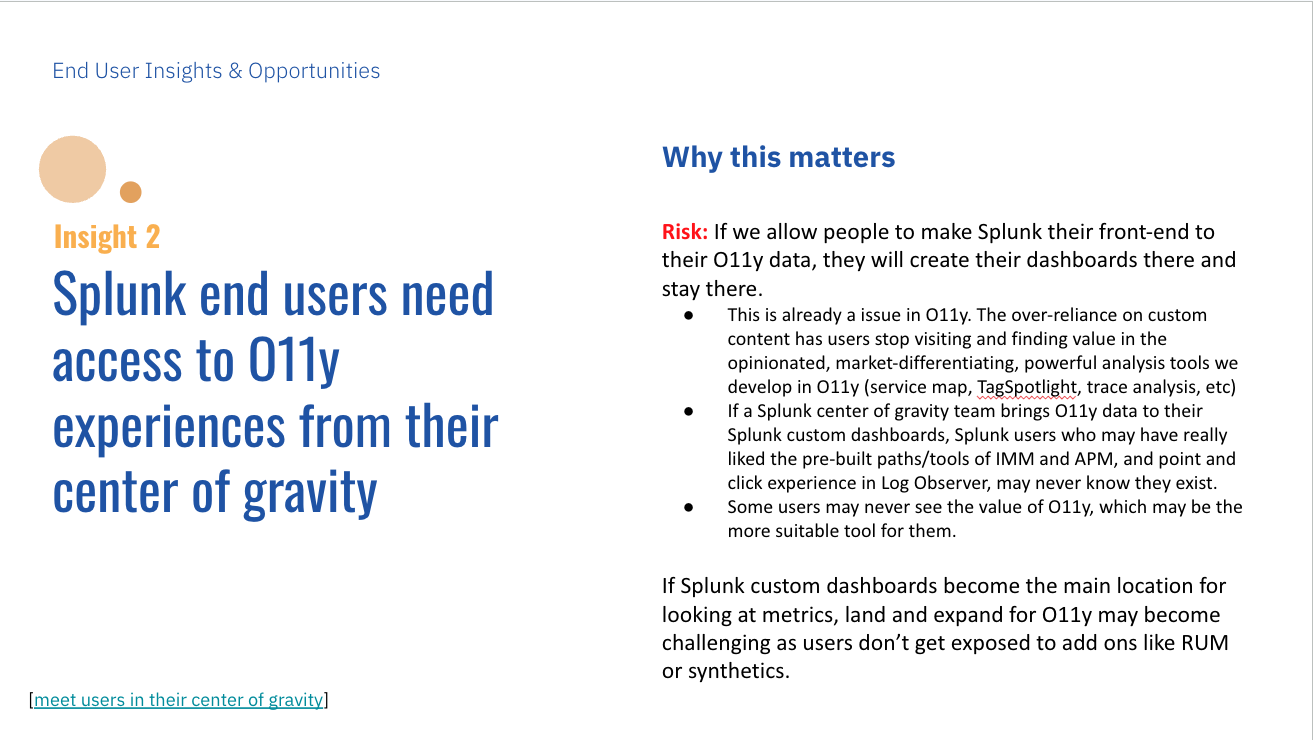
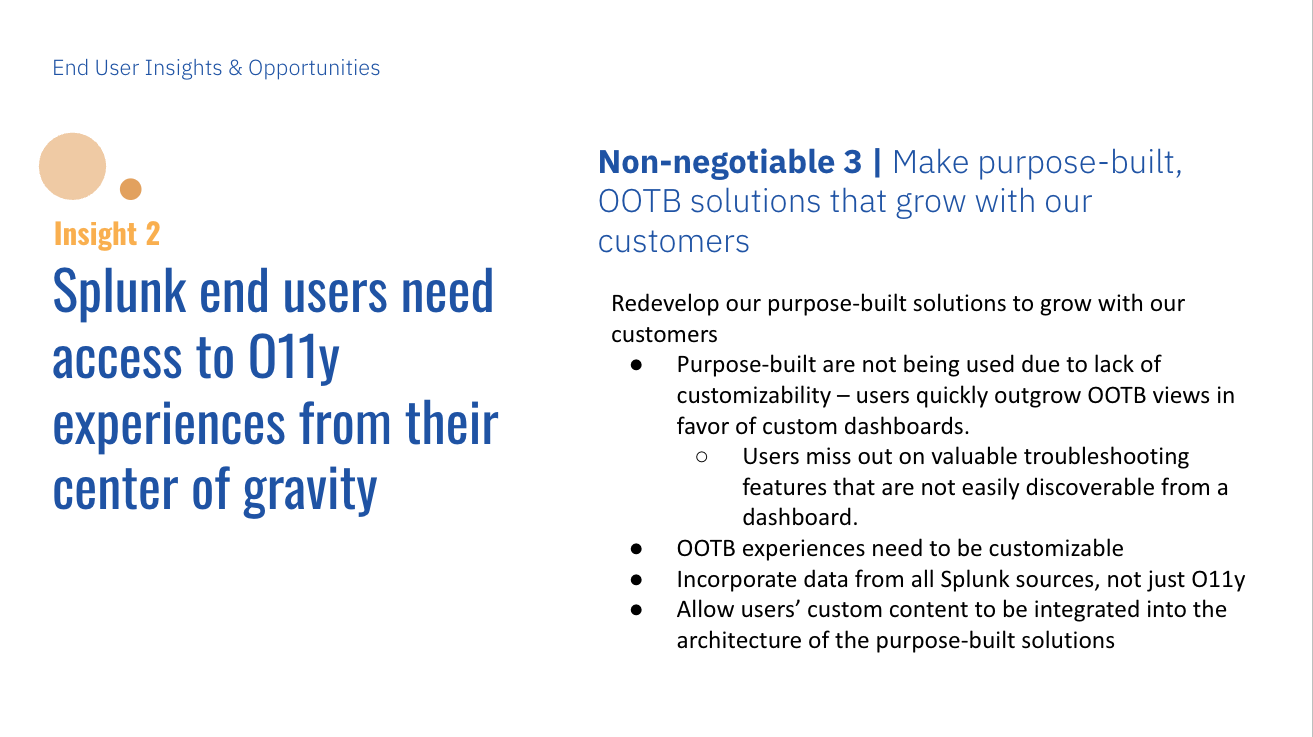
INSIGHT 2:
2 Tools is not the root of pain points for users of Splunk and Observability. We can solve end user pain points without fully unifying the front-end experiences of Observability and Splunk Cloud.
Context: Our stakeholders often mentioned a “swivel chair” pain point caused by our users needing to use two separate tools to complete one single workflow. I dug deeper into this pain point to find the root of the issue.
The ‘swivel chair’ pain point is due to clunky, contextless tool jumps, where users need to keep referencing the other tool for data they left behind. Warranted, smooth, and meaningful tool jumps are not painful, and do not cause a swivel chair effect.
There are two main reasons why tool jumps are painful today:
I lose context when I jump, and have to rebuild my context in this new tool that I might be less familiar with. How to get to a view that was relevant to my previous step? What data is available to me in this tool?
It was the wrong jump. I jumped tools, took time to rebuild context, and now I realize that this data isn’t helpful to my investigation. Back to square one.
If there is a warranted jump, with context, users see themselves switching once during an investigation. It’s not a back and forth “swivel” interaction, and it’s not a pain point.
Roadmap Outcome: Deprioritized efforts to fully unify the front-end. Product teams working on cross-product workflows were provided 2 principles to design for:
Prevent unnecessary tool jumps: offer data previews (e.g. show Observability data in Splunk Core) that allow users to determine if the tool jump will be necessary/useful.
Make warranted jumps smooth by preserving context: after jumping tools, a user should never land on a blank/unfiltered page. Allow users to bring context with them when they jump so they do not spend time re-creating context in their new tool.
Design Outcome:
The research findings inspired immediate action from product teams. Before the finalized report was even delivered, I was already working closely with a PM and a Designer to create design mockups for what an “Observability preview in Splunk Cloud” might look like.
This design utilized the above design principles to let users preview Observability data directly in Splunk Cloud to prevent unnecessary tool jumps. It also allowed users to pivot tools based on a specific piece of metadata (e.g. the name of a microservice or the hostID of a Kubernetes node) in order to bring context along with them, helping to make warranted jumps smooth by preserving context.
We brought these designs to .conf — our annual company conference — where myself and the Product Manager conducted in-person concept evaluation sessions to get feedback. The feedback was overwhelmingly positive, and was met with a tangible sense of relief and excitement from our customers. This feature is now live in Splunk Cloud.
INSIGHT 3:
If we unify the front-ends of Observability+Splunk before we unify the back-ends (i.e. make data interoperable between the two tools), we will create more problems than we solve.
Today, users struggle to know which Splunk tool has which data, features, and use cases in it.
Q: How do you decide what data goes to Splunk and what data gets sent to Observability?
A: “I have no idea. I think we have a ouija board somewhere.” - Splunk End User / Observability Admin
Today’s distinct UIs help users create a mental model of 2 (or 3 or 4) different Splunk tools. Observability and Splunk Cloud look and feel very different, which makes it easier to distinguish which tool a user is in.
Why does this matter?
A front-end that looks alike makes it feel like there is a unified back-end, further confusing users about where they are and where their data is.
Outcome: Unification of front-end aesthetics (unifying icons, color schemes, etc) deprioritized. Efforts re-focused on unifying back-end data interoperability and front-end interaction patterns (e.g. interacting with a filter dropdown in Splunk and Observability should behave the same, even if it looks different aesthetically).
An action team of designers from Splunk Core and designers from Observability was assembled to audit interaction behaviors of components in both tools to identify which interactions to “unify.”
These are just a few of many findings. The full report is packed full with more insights, quotes, highlight clips, and recommendations. Please contact me if you’d like to learn more.
impact
A few notable impacts:
Research findings and recommendations were copied and pasted into multiple Splunk Observability 3-year strategy documents.
Multiple product roadmaps adjusted — reprioritizing items, adding new items, and removing some items altogether.
4 design-led initiatives spawned from this research, with a dedicated action team assigned to each.
Design work inspired by this research was immediately prioritized, prototyped, and evaluated in-person with customers at our annual .conf conference, and was rapidly developed into the product.
Research report was presented to multiple audiences, often modified / curated to be specifically relevant to each audience. Most presentations ended with “can you present this again to my team?”
User Research was immediately asked by product leadership to inform Observability Adoption efforts — the next big-picture strategic initiative.
The following are quotes from my direct research stakeholder, Kara Gillis - Sr. Director of Product Management.
“This is the best research report I’ve seen at Splunk”
“My favorite thing I’ve worked on at Splunk because of how cross-functional it’s been”
“These priorities didn’t come out of a vacuum, they were driven by the ux research and the iterative design feedback sessions. Those have been the most important parts of this process”“I have yet to see alignment like this across Observability and Splunk”
“This really clarifies what we’re going to work on for the next 3 years”
-Kara Gillis, Sr. Director PM
challenges & learnings
This was my most strategic user research project, and it provided me with invaluable learnings, experience, and confidence going forward. User research belongs in product strategy, and this project is an example of why & how.
This project initially kicked off with me being the co-lead with another user research colleague. Midway through the interviews, my co-lead left the company for another opportunity, taking months of project context along with her. It was daunting to lose a partner mid-project on such a high stakes study, but I was fortunate enough to have the support and engagement of product partners who made this transition easier (see “thank you” section for more details).
Participant recruitment can be difficult in enterprise b2b, especially with account managers who are hesitant to provide access to customers who may be mid-negotiation. It is sometimes necessary to escalate & ask for backup in communicating the importance of these user research interviews.
Insights need to be punchy. Especially with data-heavy qualitative research such as this, you need to capture attention and be bold.
Reference user research from the past. Documentation might feel tedious and useless, but it is totally worth it. 2 years prior to this project, I had delivered a research report that I considered to, at the time, be a failure. The findings and recommendations were dismissed by the product manager, who was largely uninvolved and unenthusiastic throughout the whole process. But my findings lingered in my mind, and were extremely relevant to this particular project. Due to quality documentation, I was able to reuse video clips and frameworks from my past research report. A 2-year old “failure” suddenly felt vindicating, and provided even more data to back up this project’s recommendations.
thank you…
User Research is ineffective if conducted in a vacuum. A huge thank you to my wonderful product partners who were incredibly engaged with the entire process. Without them, this research would not have been nearly as impactful.
Danika Patrick | Sr. Manager, Design & User Research
Danika provided a ton of support and feedback during the data analysis, report generation, and communication of research recommendations — greatly increasing the impact of the findings and the buy-in on the proposed next steps.
Samo Drole | Principal UX Designer
Samo is the ideal design partner, engaging with the findings with a sense of excitement & iterating on concepts based on the research findings. By the time we were presenting findings to product leadership, we already had mockups, iterations on those mockups, and direct customer feedback.
Kara Gillis | Sr. Director of Product Management
It is rare to find a product leader who is so data-driven and user-centered. Kara gave User Research agency and flexibility, then regularly engaged with the research output — especially in early draft stages — helping to translate findings into their impact on our overall product strategy.
Ian Torbett | Sr. Product Manager
Ian would call me into roadmap discussions and immediately adjust roadmap priorities based on our findings and feedback. He proactively setup customer feedback sessions to get input on our design concepts, allowing us to implement & iterate quickly and effectively.
Darren Lasso | Principle UX Designer
Darren is the workshop master, and enabled us to apply high-level findings specifically to his workstream. The resulting workshops not only brought stakeholders more closely to the research itself, but also gave room for cross-functional brainstorming and solutioning.
Andrea Fineman | Sr. User Researcher
Andrea was my co-lead at the beginning of the project. She and I co-created the interview script, and she helped overcome many recruitment hurdles — user research is not meaningful if the participants are not the right fit.